The fine particles are generally specified according to their screen analysis. A screen analysis of a material is carried out by using testing sieves. A set of standard screens is arranged serially in a stack in such a way that the coarsest of the screens is at the top and the finest of the screens is at the bottom.
An analysis is carried out by placing the sample on the sample on the top screen and shaking the stack in a definite manner, either, manually or mechanically, for a definite length of time. Time material retained on each screen is removed and weighed. For reporting the screen analysis, the amount of material retained on each screen is expressed as the weight fraction of the total sample.
Differential Screen Analysis
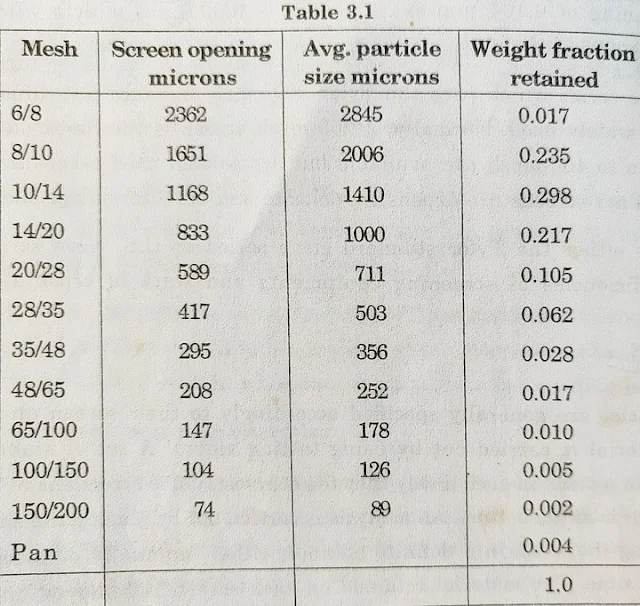
The screen analysis of a sample is reported either in a tabular form or as graphs. The results of a screen analysis can be reported in a tabular form to show the weight fraction of the material retained on each screen as a function of the mesh size. As the particles retained on any one screen are passed through the screen immediately above it, two numbers are needed to specify the size, one for the screen through which the fraction passes and the other for the screen through which that fraction is retained.
Hence, the notation 10/14 means through 10 mesh and on 14 mesh (i.e. the material is such that it passes through the screen of mesh number 10 and collects on the screen of mesh number 14). An analysis reported in a tabular form in this manner is called differential analysis.
The material that is retained on the screen is oversized or plus (+) of that screen and the material that passes it is undersized or minus (-). Thus, a - 10 + 14 fraction means the fraction of the material that passes through a 10-mesh screen but is retained on a 14-mesh screen.
Differential Screen Analysis Table (3.1)
The average particle size of the material retained on any particular screen (cited in the table) is calculated as the arithmetic means of two screen openings used to obtain the fraction.
Cumulative Screen Analysis
Another method of reporting screen analysis is cumulative analysis. The cumulative analysis is obtained from differential analysis by adding comparatively the individual weight fractions of material retained on each screen, starting with that retained on the largest mesh, and tabulating or plotting the cumulative sums against the screen opening of the retaining screen of the last to be added.
If we define ф by the equation of the from:
ф = ∆ф₁ + ∆ф₂ + .............. + ∆фNT = ∑⬆NT ↓N=1 ∆фN
Where ∆ф₁, ∆ф₂.... are the weight fractions of material retained on screens 1, 2.....numbered serially from the top of the deck.
Then, the cumulative analysis is the relation between ф and screen opening. The quantity ф is the weight fraction of the sample that consists of particles larger than the screen opening. For the entire sample, the value of ф is unity. The cumulative analysis corresponding to the differential analysis of table (3.2) is shown in the table.
ф = cumulative fraction retained on the screen
1 - ф = cumulative fraction passing through a screen.
The cumulative analysis is also reported by incorporating a cumulative fraction passing through the screen as:
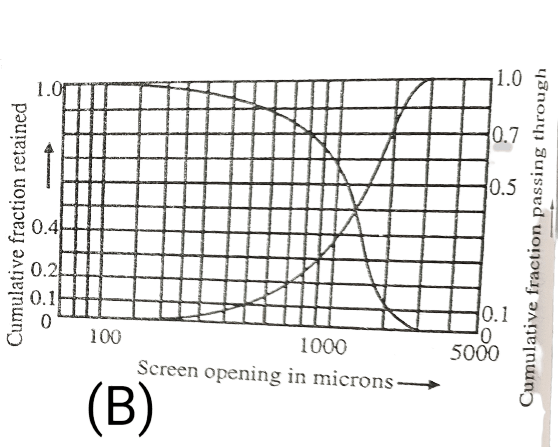
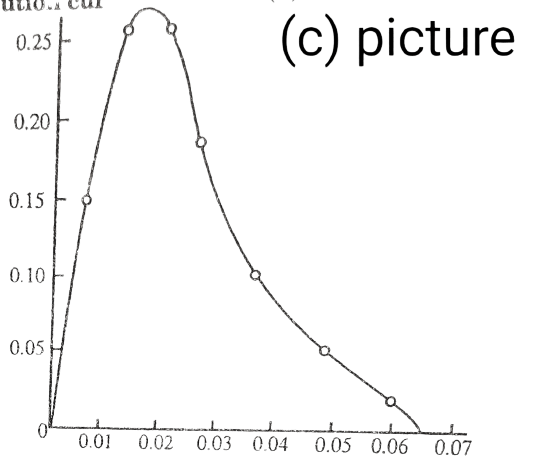
A graphical presentation of the screens analysis can be done on ordinary graph paper but more conveniently on semilogarithmic papers where the size is plotted on a logarithmic scale. A semilogarithmic plot avoids the crowding of most of the data into a small section of the diagram. The results of screen analysis presented as fractional or cumulative distribution curves are shown in pictures (a) and (b).
Fractional distribution Curve (graph) (a)
Cumulative distribution curves (graph) (b)
The fractional distribution curve is obtained by plotting the weight fraction of material retained against average particle size and the cumulative distribution curves shown in picture (c) are obtained by plotting the fraction of the total weight of particles having a size greater than or less than a given screen opening.
Fractional distribution plot on ordinary graph paper.
Fractional distribution plot on semilog graph paper.
Take these Notes is, Orginal Sources: Unit Operations-II, KA Gavhane


